Usage Finder
Your Mac, in the menu bar.
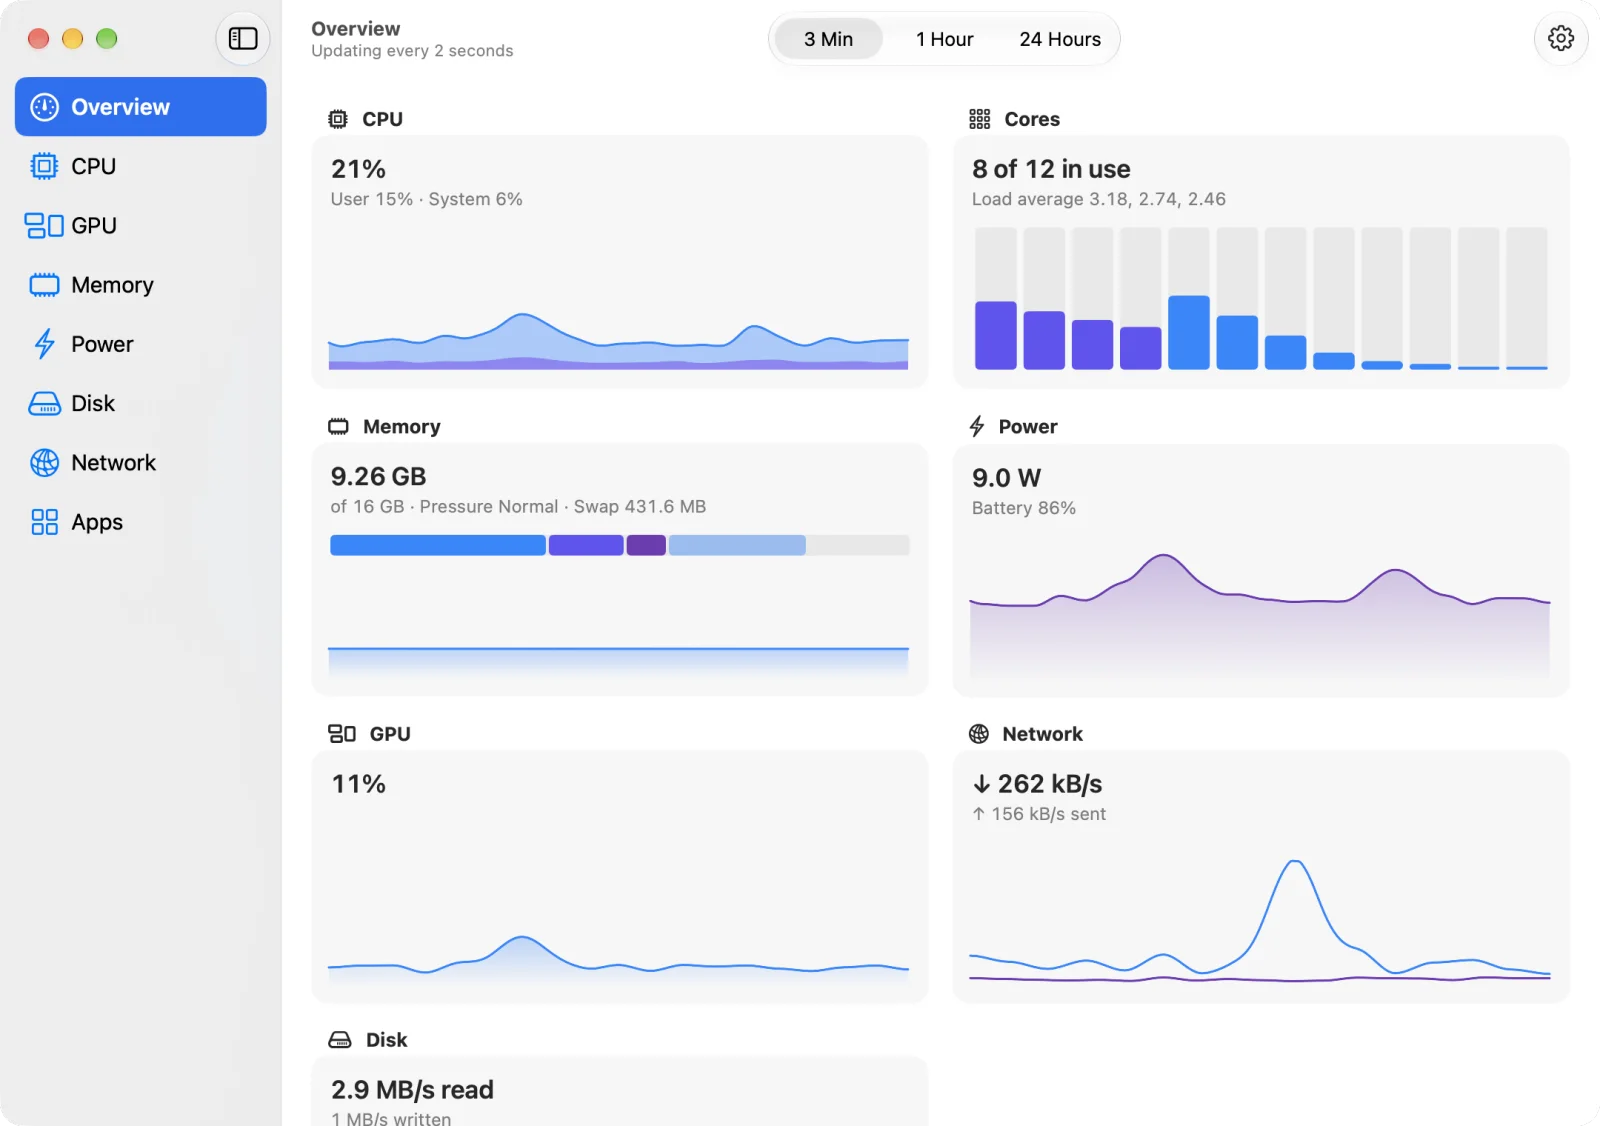
A native system monitor for macOS. Usage Finder puts live CPU, memory and power meters in your menu bar, and a window with charts for every part of the Mac, from each core to the apps keeping it busy.
Menu bar
Three meters, always in view.
CPU, memory and power each get their own menu bar item, so you can turn any one off or ⌘-drag it into place. Click one for a summary of everything else: GPU, network, disk, swap, load and battery.
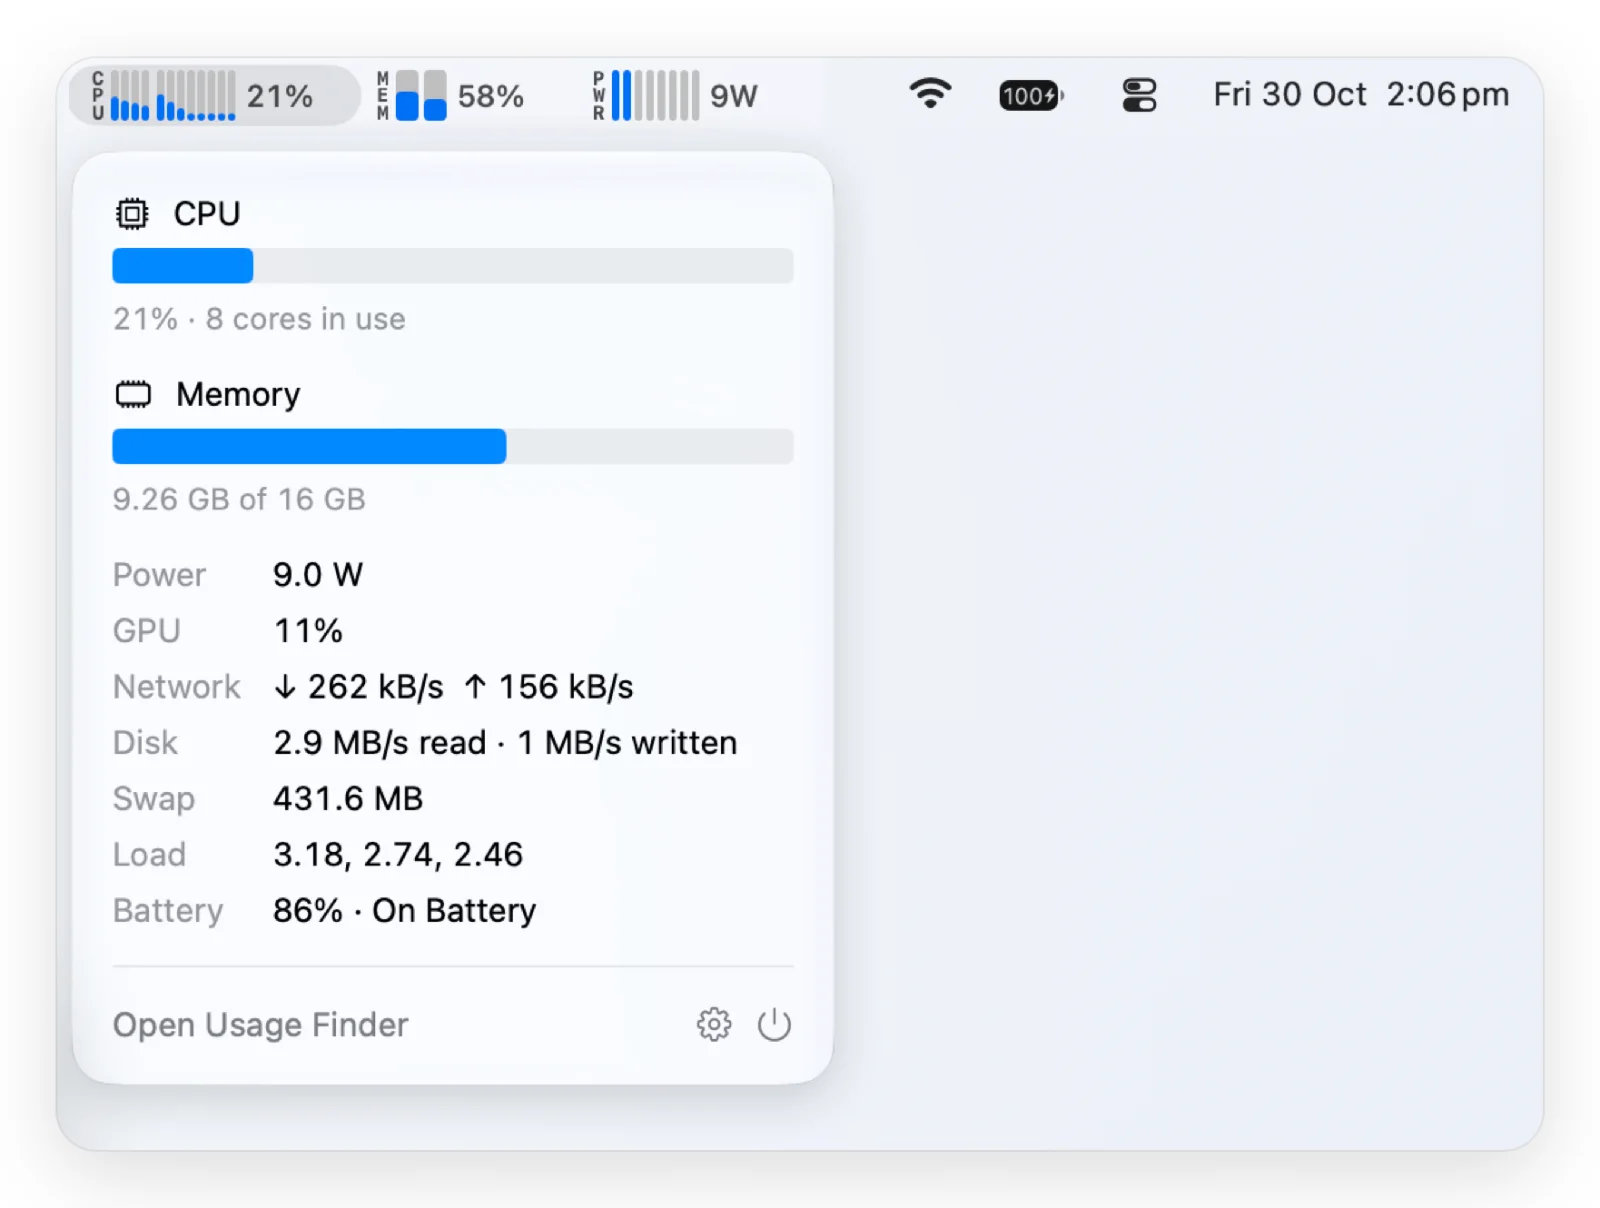
- CPU as a bar for every core, one per core type, or a single total
- Memory and swap side by side; power as a level meter in watts
- In colour or in black and white, to match the rest of your menu bar
History
See the last day, not just the last second.
Every chart switches between the last 3 minutes, hour and 24 hours. Recent readings are kept as they are, longer ranges as averages, and the history is saved on your Mac so it's still there next time you open the app.
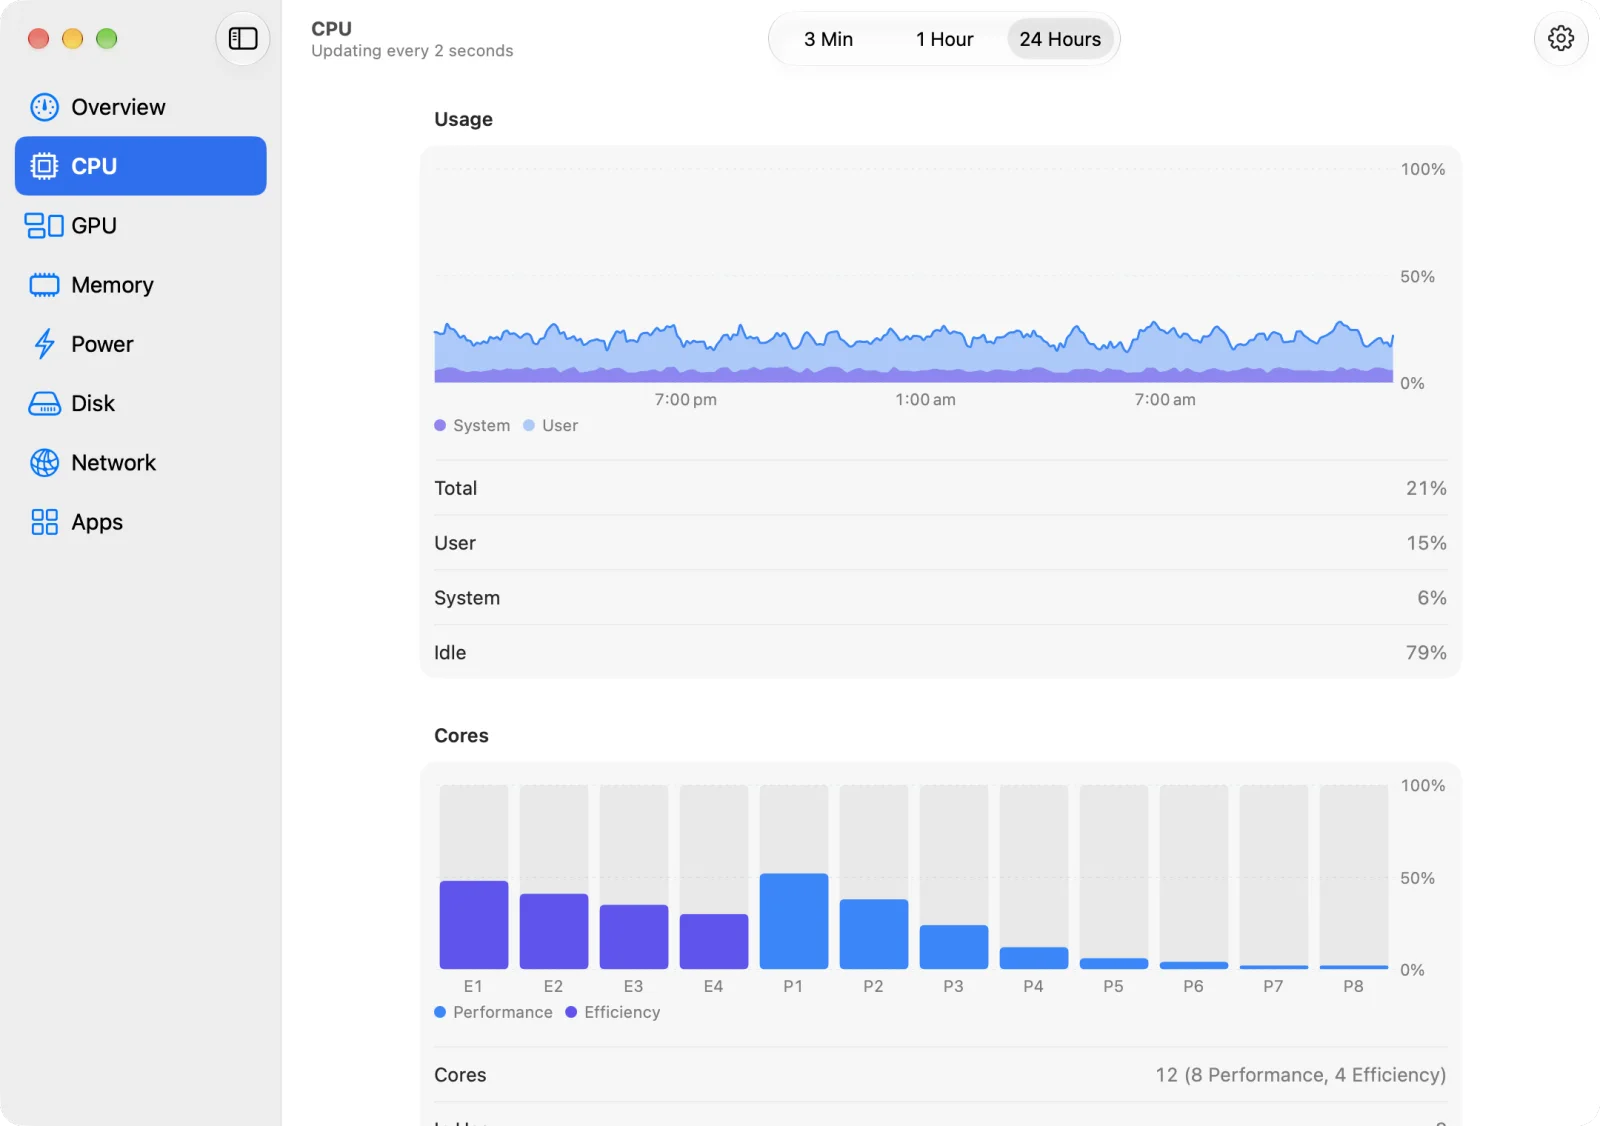
- Usage per core, split into performance and efficiency cores
- Memory by kind, with memory pressure and swap
- Gaps where Usage Finder wasn't collecting, never lines drawn across them
Apps
Find what's slowing your Mac down.
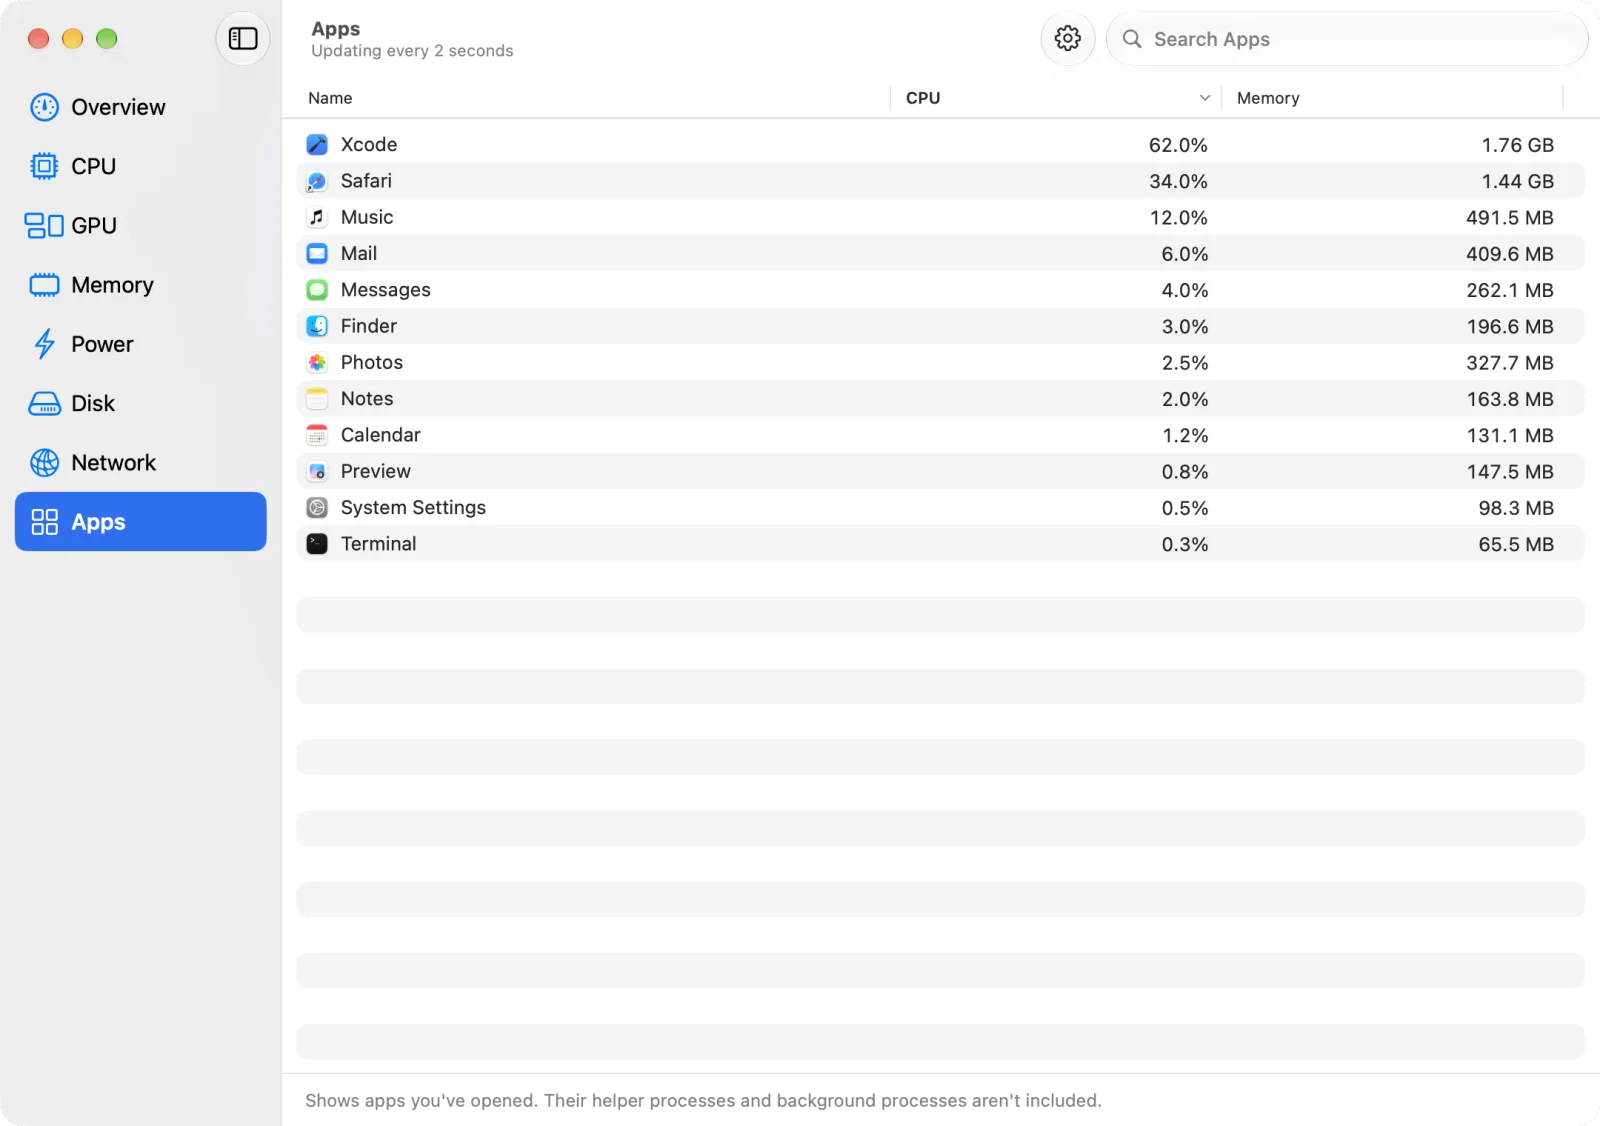
The Apps pane lists what's using the CPU and memory, busiest first, with search. The direct download counts helper processes towards the app they belong to, so a browser's renderers add up to the browser, and adds columns for each app's power and process count.
Power
Watts for the whole Mac.
The direct download reads total system power straight from the System Management Controller, with figures for the CPU, GPU, Neural Engine and memory from the chip's energy model, plus temperatures and fan speeds. The Mac App Store edition reads power from the battery instead.
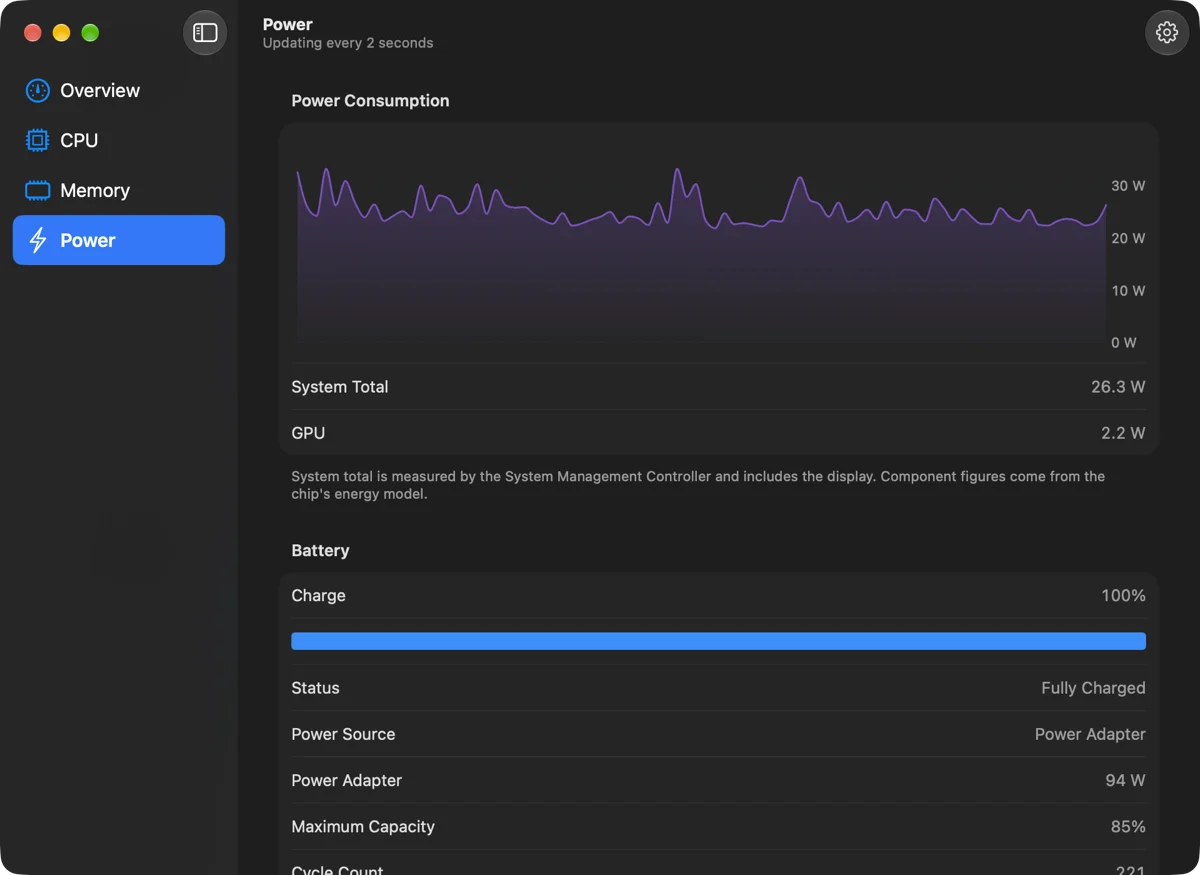
- Battery charge, maximum capacity, cycle count and the adapter's wattage
- Thermal state, as macOS rates it
And the details.
- 3live meters in the menu bar: CPU, memory and power
- 24 hof history in every chart, kept between launches
- 8panes, from the Overview to Apps
GPU, disk, network
Each with its own chart, live rates and totals since startup.
Widget
CPU, memory, GPU and power on your desktop, in small and medium sizes.
Shortcuts
Ask for CPU, memory, GPU or power, or the busiest apps right now.
Light on the Mac
Samples every 1, 2 or 5 seconds, and less often in Low Power Mode.
Stays out of the way
Opens at login, hides from the Dock if you like, and keeps its meters after you quit.
Updates itself
The direct download is notarised and installs new versions with Sparkle.
How it's built
Swift, SwiftUI, Swift Charts.
Usage Finder is written in Swift: SwiftUI and Swift Charts for the window, AppKit for the menu bar, and IOKit and Mach calls for the readings. Two editions build from the same sources: a direct download, notarised and released by one script to GitHub with a Sparkle appcast, and a sandboxed edition for the Mac App Store.
- Swift
- SwiftUI
- Swift Charts
- AppKit
- IOKit
- Sparkle
Reading the hardware
CPU from per-core tick counters, power from the SMC over IOKit, and energy per component from IOReport. A component only appears after several live readings, so a frozen counter never shows up as 0 W.
Idle when nobody's looking
Sampling runs only while something shows it: a visible window, the panel or a live meter. Window occlusion tells it when the window is covered or minimised, and with every meter off the app does no background work.
Meters drawn by hand
A menu bar item can show only one image, so each meter is drawn with Core Graphics at a fixed width on whole Retina pixels, and redrawn only when something it shows visibly changes.