Visualizing Renewable Energy
Renewable energy, in five charts.
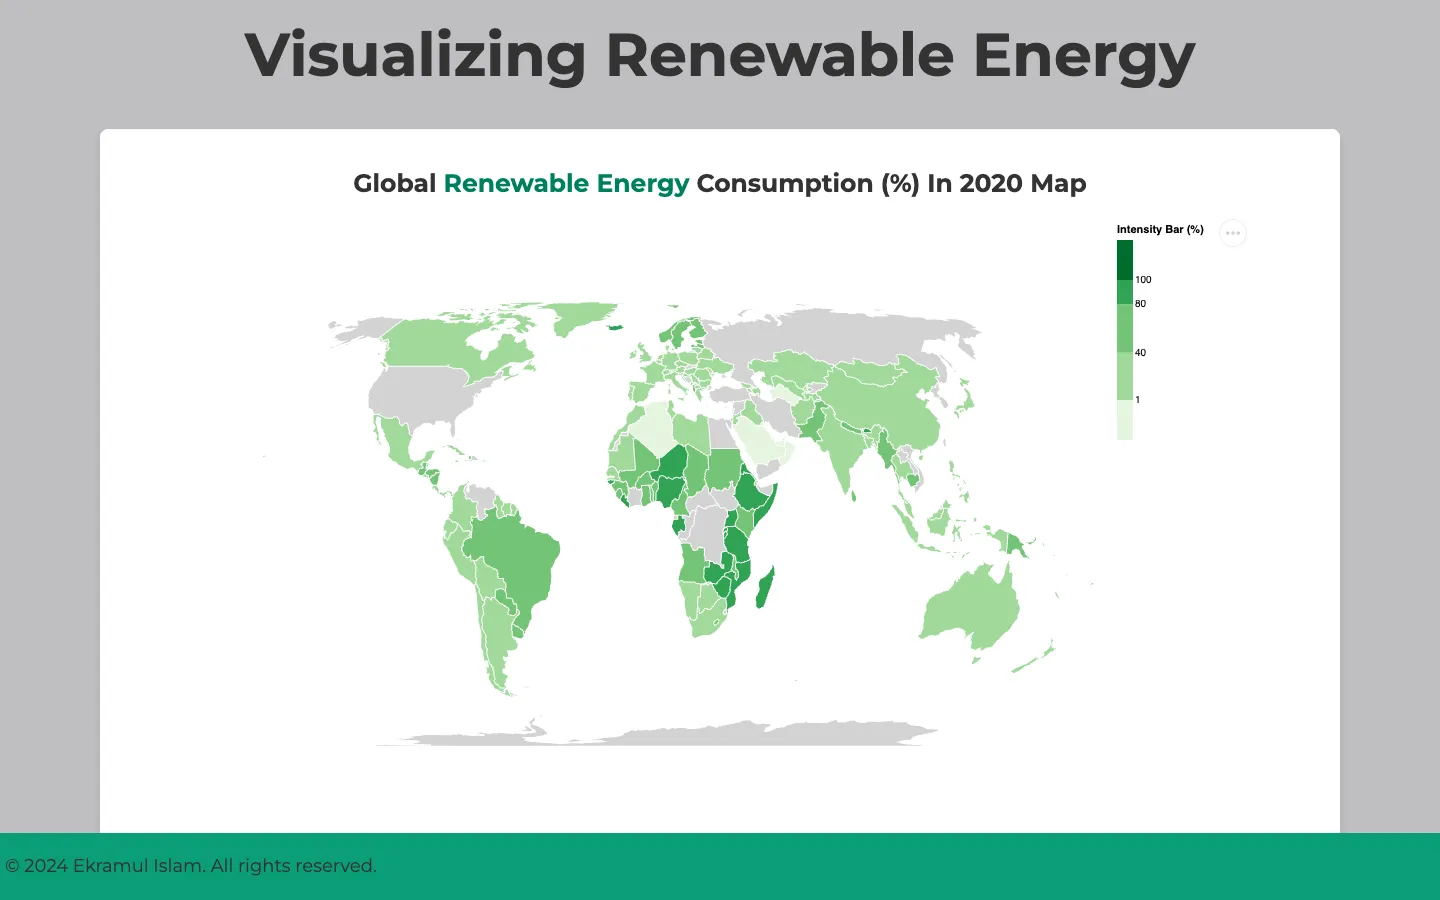
An interactive dashboard on renewable energy around the world, built with Vega-Lite for FIT3179, Monash University's data visualisation unit. A map, a bar chart, a donut, a stacked area and a stacked bar chart each take one angle on the data, starting from the World Bank's figures for how much of each country's energy is renewable.
Production
Five kinds of energy, side by side.
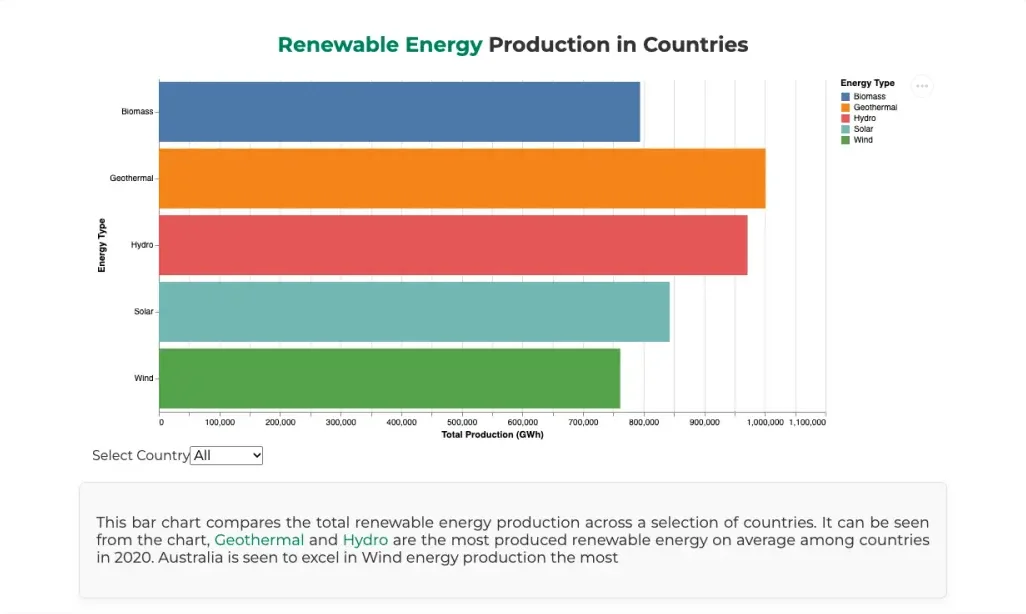
A horizontal bar chart totals 2020 production, in gigawatt-hours, for biomass, geothermal, hydro, solar and wind. Pick a country from the menu, the USA, Australia, Canada, China or Japan, and the bars re-total for that country alone.
Mix
The 2022 mix in one ring.
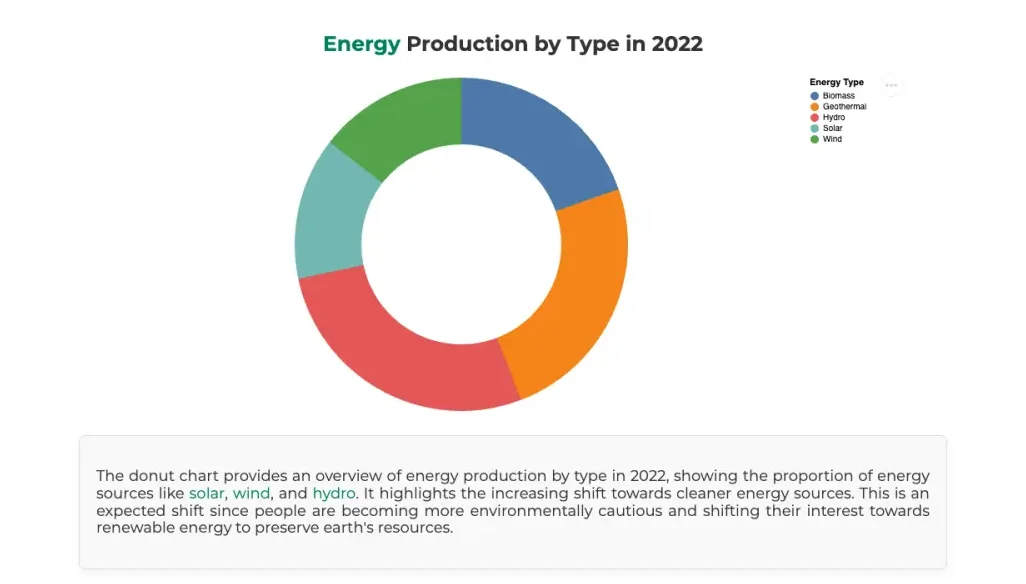
A donut chart shows each energy type's share of production in 2022. It keeps the bar chart's colours for each type, so the two charts read as one.
Trends
Thirty years of renewable share.
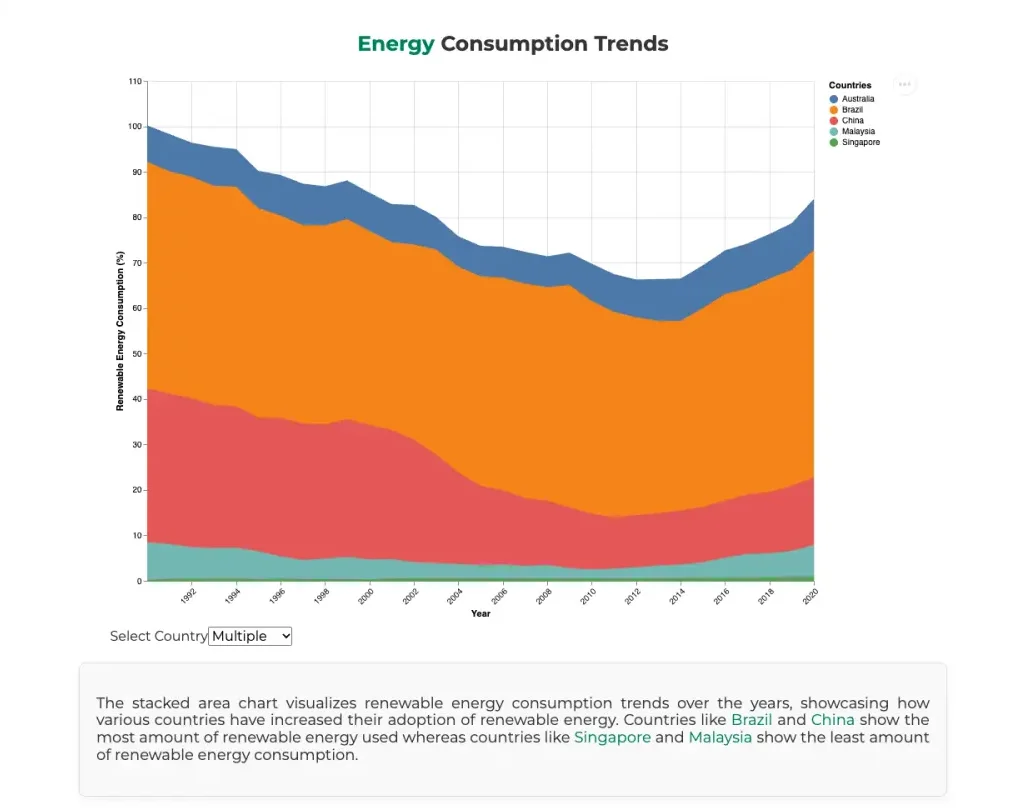
A stacked area chart follows the World Bank's renewable share of energy use from 1990 to 2020 for Australia, Brazil, China, Malaysia and Singapore. Choose one country from the menu to see it on its own.
Countries
Five countries, year by year.
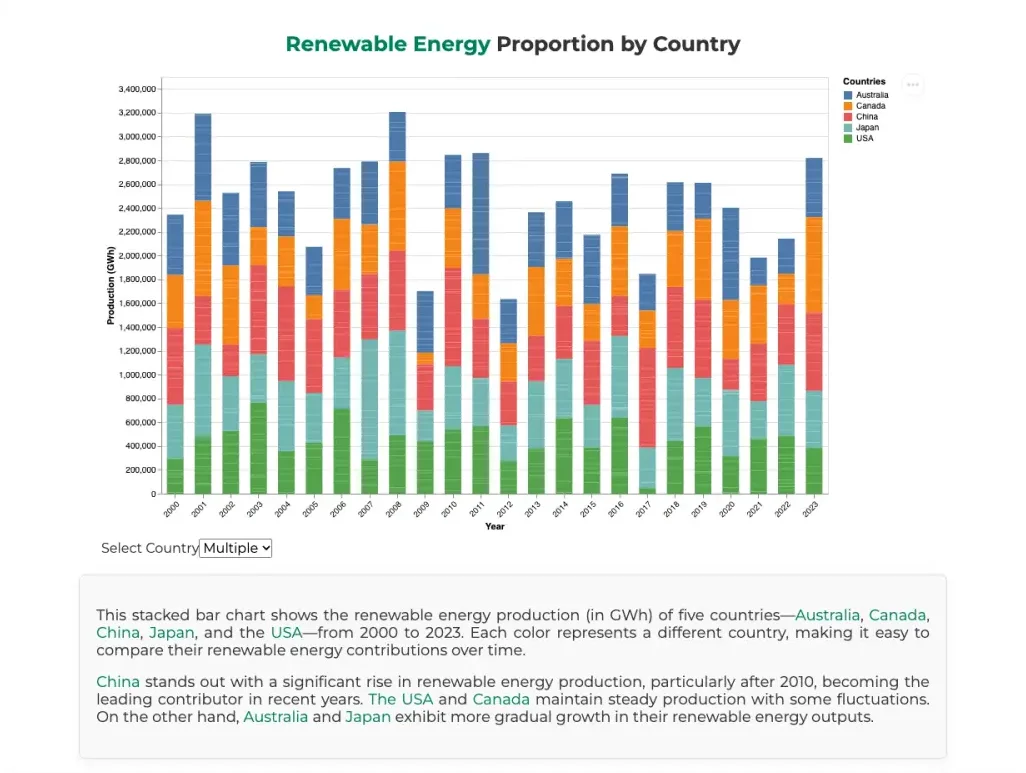
A stacked bar chart breaks renewable production down by country for Australia, Canada, China, Japan and the USA, every year from 2000 to 2023. Hover a segment for its exact figure, or pick one country to compare its years alone.
And the details.
- 5chart idioms, each with its own reading
- 212countries and regions in the World Bank data
- 31years of renewable share, 1990 to 2020
Intensity slider
A slider on the map hides every country below a renewable share you choose, from 0 to 100%.
Tooltips
Hover any country, bar or segment for its exact value. Grey countries say there's no data for them.
Written readings
Each chart has a short reading beneath it, with the countries and energy types it mentions picked out in colour.
Equal Earth
The map uses the Equal Earth projection, so countries keep their true sizes relative to each other.
Sketched first
The dashboard was planned on paper with five design sheets, which are in the repository.
How it's built
Vega-Lite, Vega-Embed, TopoJSON.
One static HTML page, published with GitHub Pages and with no build step. Each chart is a Vega-Lite spec in its own JSON file, embedded with Vega-Embed and laid out with Pure.css. The World Bank data was cleaned and reshaped with pandas first.
- Vega-Lite
- Vega-Embed
- TopoJSON
- Python
- HTML/CSS
Joining data to the map
The map loads Natural Earth country shapes as TopoJSON and looks up each country's World Bank figure by name. A grey layer underneath catches every country without a match, so the map has no holes.
Steps, not a gradient
The map's colour scale is a threshold scale: five greens with breaks at 1, 40, 80 and 100%. Each country falls in one band, which can be read straight off the legend.
Menus as parameters
Each country menu is a Vega-Lite parameter bound to a select input, which the chart's filter transform reads. Choosing a country filters and re-totals the data in the browser, with no JavaScript of my own.