F1 Pinnacle Of Motor Sports
Formula 1, on one dashboard.
A Tableau dashboard on Formula 1: where its drivers come from, and how the leading drivers and teams scored and won from 2010 to 2023. Five charts run down one long page, each with a short written reading of what it shows.
Drivers
Five drivers, fourteen seasons.
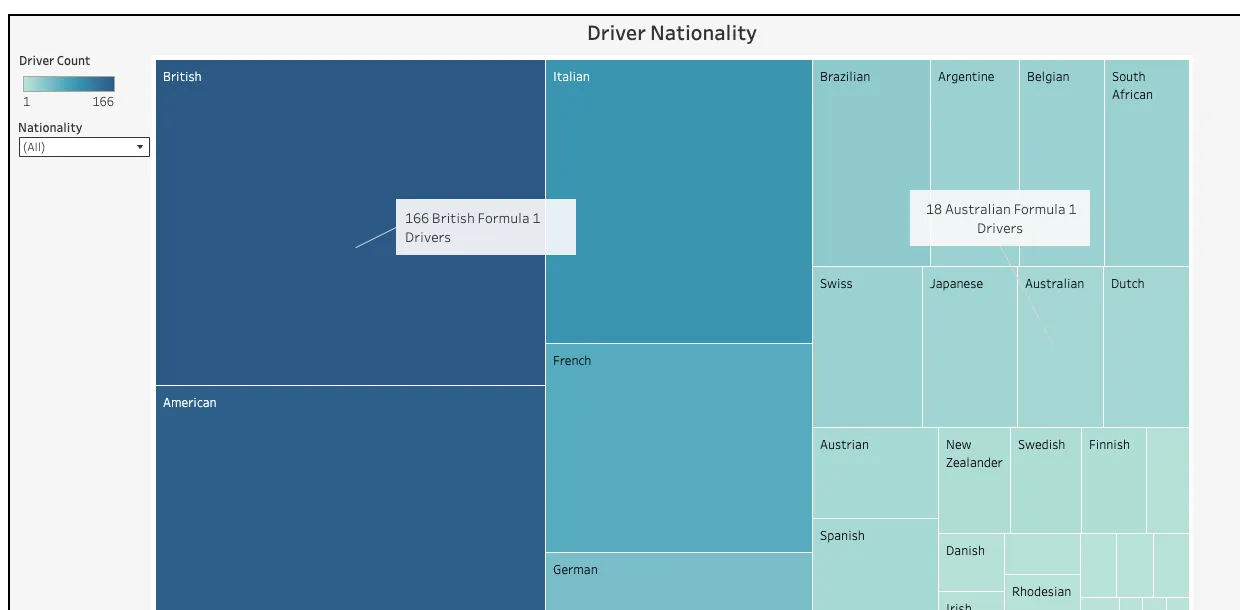
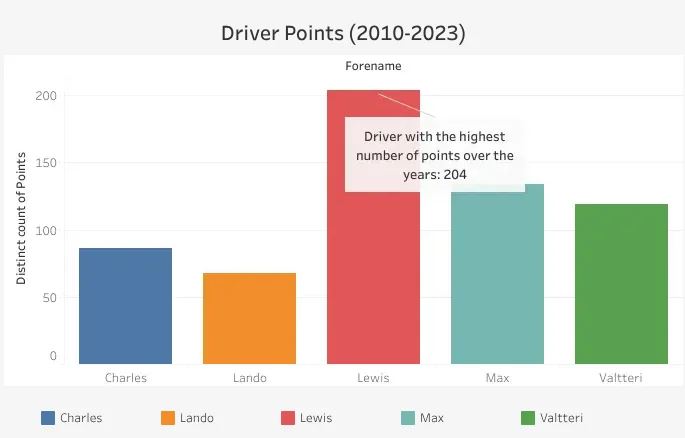
The dashboard opens on a treemap of every driver nationality, with a filter to pick out one country. Below it, Driver Points compares five drivers of the 2010 to 2023 era: Charles Leclerc, Lando Norris, Lewis Hamilton, Max Verstappen and Valtteri Bottas. Hamilton's bar is the tallest, and the reading beside it puts that down to his dominance over the period.
Constructors
Points by team, season by season.
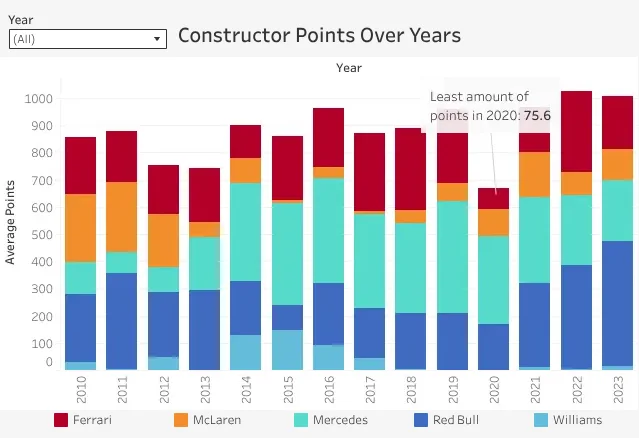
Constructor Points stacks Ferrari, McLaren, Mercedes, Red Bull and Williams for each year from 2010 to 2023, with a Year menu to show one season. The reading notes Mercedes and Red Bull at the front, particularly after 2014, and the dip in 2020, called out at 75.6, when the COVID-19 pandemic shortened the season.
Over time
The same five teams, as one shape.
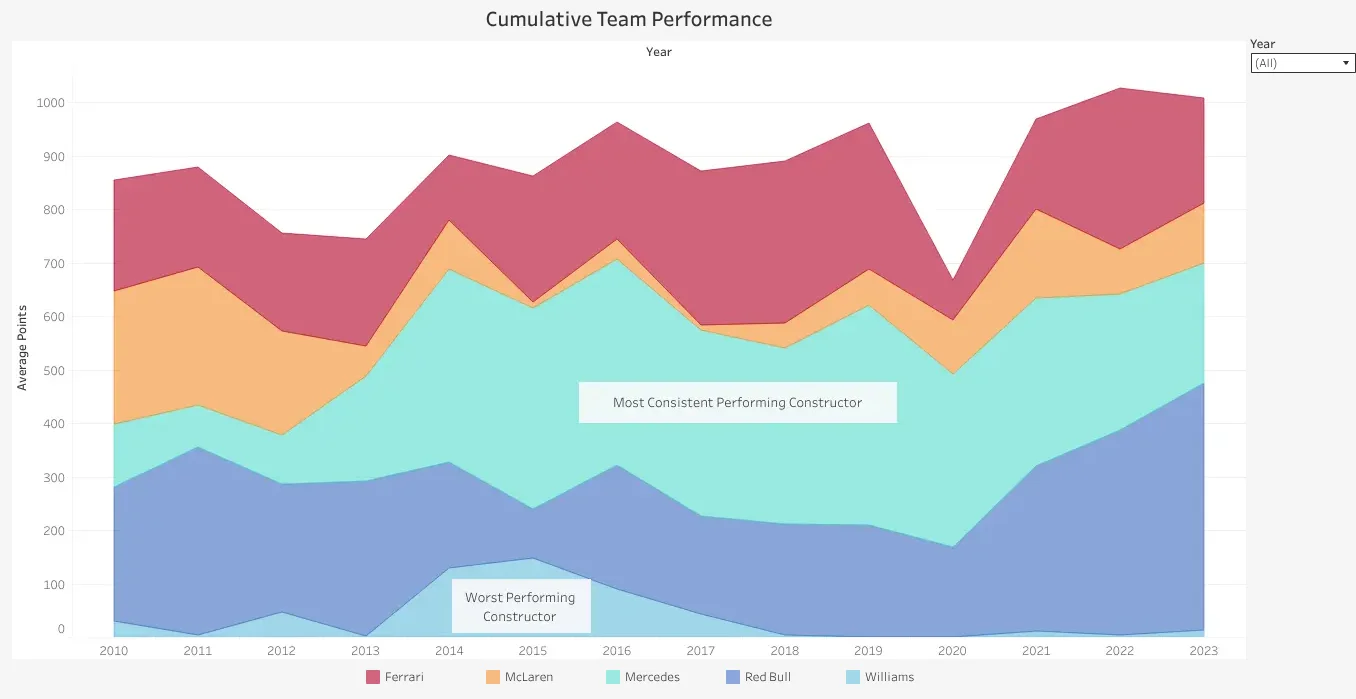
Cumulative Team Performance draws those points again as a stacked area, so the balance between the teams reads as a shape over the years. Labels mark Mercedes as the most consistent constructor and Williams as the worst performing.
Wins
Who won, year by year.
Team Wins plots each team's race wins per season as a line. It ends on Red Bull's 21 wins in 2023, called out as the most in a single year.
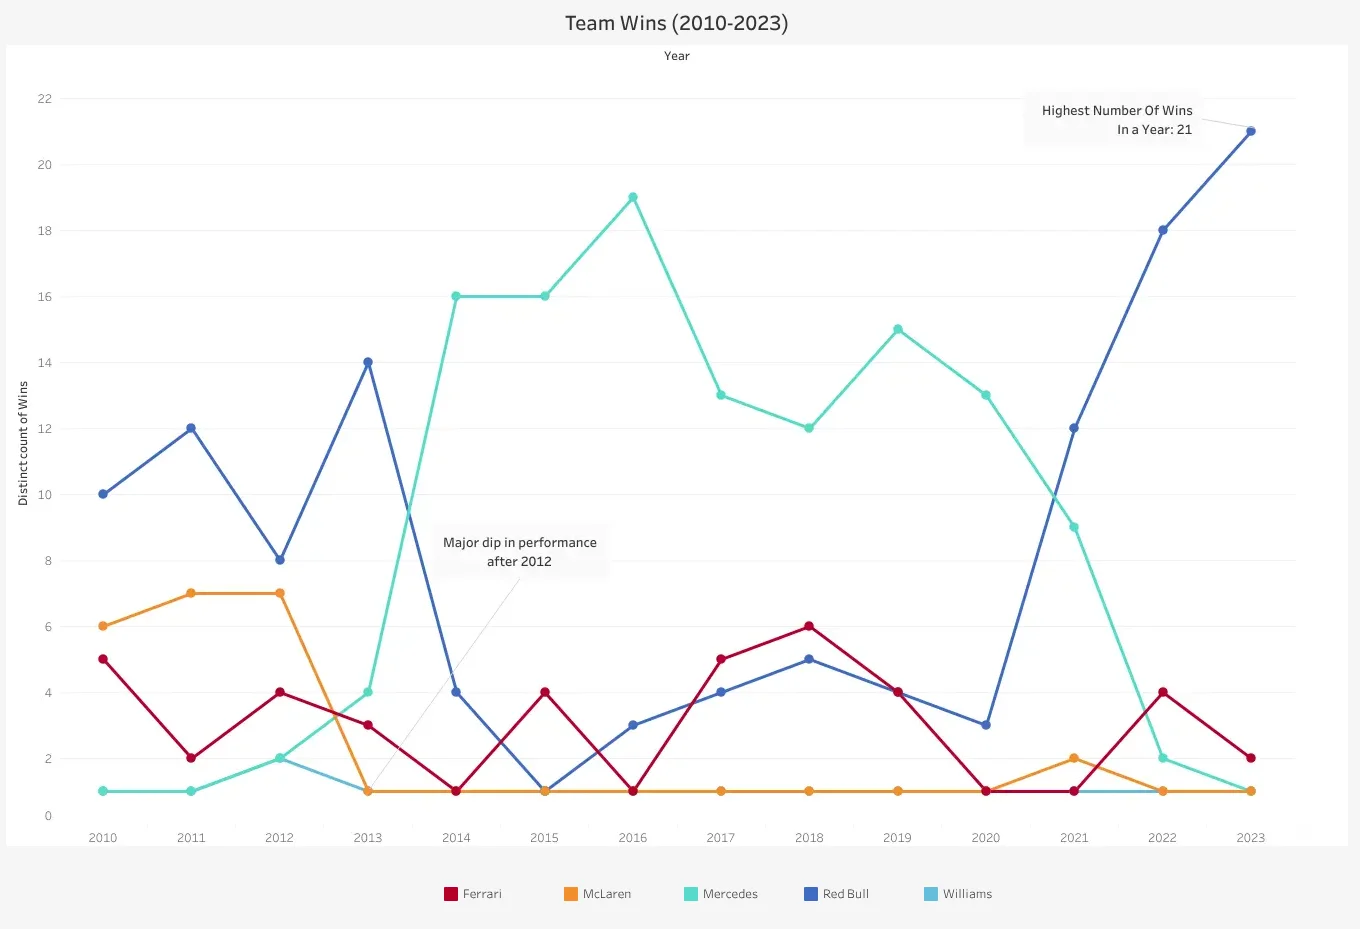
- Mercedes leads every season from 2014 to 2020
- McLaren's drop after 2012 is called out
- Red Bull falls back after 2013, then climbs again from 2021
And the details.
- 5charts on one dashboard
- 166British drivers, the largest group in the treemap
- 14seasons, 2010 to 2023, in the driver and team charts
Filters
Nationality and Year menus narrow the treemap and the team charts to one country or one season.
Callouts
Notes on the charts point out the most points, the 2020 low and the most wins in a season.
Written readings
Every chart has a reading beside or beneath it, with the names that matter in bold.
One colour per team
Ferrari red, McLaren orange, Mercedes teal, Red Bull blue and Williams light blue, in every team chart.
Tableau Public
Published on Tableau Public, so anyone can open it and use the filters in a browser.
How it's built
Tableau, Data Visualisation, Statistical Analysis.
Built in Tableau and published to Tableau Public. Each chart is its own worksheet, from Driver Nationality to Team Wins, placed on one long dashboard with a text panel for each.
- Tableau
- Data Visualisation
- Statistical Analysis
Size and colour together
In the treemap, both the area and the shade of each block stand for its driver count, on a scale from 1 to 166. The long tail of small nationalities still fits beside Britain's block.
Bars, then areas
Constructor points appear twice: as stacked bars to compare single seasons, then as a stacked area to show the trend. Both use the same five teams in the same colours, so one leads into the next.
Labels on the chart
The key points are written on the charts themselves, such as the 204 in Driver Points, 2020's 75.6 and the 21 wins in 2023, so the story reads without hovering.